Disclosure: This report represents one of a series of analyses conducted as part of a collaboration between Matthew B. Ross of Northeastern University and Gannett Co. Inc. However, the analysis contained in this report was conducted soley by Matthew B. Ross. All views expressed herein are made solely on behalf of the author. Financial support for this report was provided exclusively by Northeastern University under the Community to Community Impact Accelerator. Data on Massahcusetts traffic stops from 2014-22 were obtained through a series of Freedom of Information Act requests filed by Jeanntee Hinkle of Gannett Co. Inc.
Summary
The overarching finding from the analysis of Massachusetts traffic stop data between the years of 2014-22 is that there is strong evidence to suggest Massachusetts police are more likely to stop a person of color during periods where they can more easily discern their race and ethnicity. This study was conducted using a solar visibility analysis, comparing the likelihood that a traffic stop is made of a motorist in the daylight versus darkness. To account for the fact that the underlying driving population varies throughout the day, the analysis focused on windows of time between the earliest and latest sunset of the year and immediately before and after daylight savings. The estimates suggest that Black/African American motorists and Hispanic/Latinx motorists were 2% and 6% more likely to be stopped by Masschusetts police during periods of time when their race was more easily discernable. To put these disparities into perspective, the estimates suggest that Massachusetts police may have made as many as 11,564 and 33,543 excess stops from 2014-22 (approximately 1,284 and 3,727 per year) of Black/African American and Hispanic/Latinx motorists respectively.[1] While the magnitude of the estimates varied from year to year, a statistically significant disparity was estimated in six of the nine years analyzed and for the entirety of the period from 2014-22. Focusing on the most recent three years of data from 2020-22, a total of 33 agencies (11 state police troops and 22 municipal agencies) were found to be more likely to stop a person of color during periods when motorist’s race was more easily observed.
These findings are in stark contrast to the “2020 Massachusetts Uniform Citation Data Analysis Report” released in February of 2022 which reported no statewide disparity as well as only three departments with statistically significant disparities.[2] While the period analyzed in that report is considerably shorter than the 2014-22 period examined in this analysis, there are also several underlying methodological issues with the solar visibility analysis contained therein. In particular, the methodology employed by the researchers deviates significantly from what is broadly considered best practices from the literature on empirical testing of traffic stop data from evidence of disparity.
In light of both of these sources of potential measurement error and their impact on the estimates, this analysis should be considered a very conservative estimate of disparate treatment that most likely underestimates the overall magnitude. There are two sources of potential measurement error in the traffic stop data underlying this analysis which are worth noting explicitly. First, Massachusetts ceased uniform collection of verbal and written warnings in 2002. In traffic stop data from Connecticut and Rhode Island collected over a similar period, warnings represented 49.74% and 53.99% of total traffic stops. Since the scientific literature suggests that persons of color are more likely to be involved in pre-textual traffic stops, it is likely that the omission of verbal warnings from this analysis is potentially biasing the estimates away from finding discrimination, even if it exists. Second, analysis of the surnames recorded in the underlying data by reporters at Gannett suggests intentional misreporting of Hispanic/Latinx motorists as White non-Hispanic. Systematic measurement error in terms of race/ethnicity is also likely to be biasing the estimates contained in this analysis away from finding discrimination even if it exists.
[1] These back-of-the-envelope calculations assume that the solar visibility estimates are generalizable to the level of disparity observed during other times of the day outside the inter-twilight window. Thus, we multiply the point estimates from the solar visibility analysis by the global means of 13.32% and 12.88% of the 4,341,000 traffic stops being recorded as involving a Black/African American motorists or Hispanic/Latinx motorists.
[2] See: https://www.mass.gov/doc/2020-massachusetts-uniform-citation-data-analysis-report/download
Solar Visibility Analysis
The canonical challenge to assessing whether there are racial and ethnic disparities in the decision by police to stop a motorist is the lack of an appropriate counterfactual. Put simply, reliable data on the demographic composition of motorists is nonexistent and so there is not an available benchmark for evaluating police traffic stops. To overcome this challenge, we implement a solar visibility analysis following Grogger and Ridgeway (2006). A solar visibility analysis compares the likelihood that a traffic stop is made of a motorist of color during daylight relative to darkness (see also Ridgeway 2009; Horrace and Rohlin 2019; Kalinowski et al. 2018, 2020, 2022). Ross et al. (2020) cites 18 cities and four states that have relied on a solar visibility analysis to evaluate the decision to stop a motorist and describe the test as being widely considered by practitioners and policymakers as “best practice”.[3] The authors demonstrate that, under a certain set of conditions, a change from daylight to darkness in the odds of a stopped motorist being a person of color is equivalent to a change in the odds a person of color is stopped. Under the assumption that the only thing changing between daylight and darkness is the ability of police officers to detect race prior to making a traffic stop, an increase in the likelihood that a motorist of color is stopped during daylight is indicative of disparate treatment and possible discrimination.
The population of data included 4,341,000 traffic stops made by all policing agencies in Massachusetts from January 2014 to December 2022.[4] Here, we apply a solar visibility analysis to assess the extent of racial and ethnic disparities in the decision to stop a motorist. To account for the fact that enforcement activity and the underlying composition of motorists may be different at different times of the day, we restrict the analytical sample to traffic stops falling within a window of time when sunset varies seasonally. In particular, we focus on 943,195 traffic stops occurring within the “inter-twilight window” between the earliest sunset (approximately 4:09 p.m.) and the latest end to civil twilight (approximately 9:05 p.m.) of each year. Since some infractions (lighting, seatbelt, cellphone, and administrative violations) are correlated with visibility and (possibly) race through socioeconomic factors, we further restrict the analytical sample to 629,139 stops that include at least one moving violation (see Ridgeway 2009).[5] To account for potential variations across time and geographic space, we utilized regression analysis and control for variables such as time of day, day of week, and year by geographic location or individual officer (see Horrace and Rohlin 2019; Kalinowski et al. 2018). To address potential concerns of endogeneity associated with seasonal differences in driving and enforcement, we will also implement a robustness test focusing on a narrow window of time before/after the spring/fall daylight savings timer shift using a regression discontinuity design (see Kalinowski et al. 2020).
[3] Applications of the test include Grogger and Ridgeway (2006) in Oakland, CA; Ridgeway (2009) Cincinnati, OH; Ritter and Bael (2009) and Ritter (2017) in Minneapolis, MN; Worden, McLean, and Wheeler (2010,2012) as well as Horace and Rohlin (2016) in Syracuse, NY; Renauer, Henning, and Covelli (2009) in Portland, OR; Taniguchi et al. (2016a,2016b,2016c,2016d) in Durham Greens-boro, Raleigh, and Fayetteville, North Carolina; Masher (2016) in New Orleans, LA; Chanin et al. (2016)in San Diego, CA; Criminal Justice Policy Research Institute (2017) in Corvallis PD, OR; Milyo (2017) in Columbia, MO; Smith et al. (2017) in San Jose, CA; and Wallace et al. (2017) in Maricopa, AZ. Statewide studies relying on this test include Ross, Fazzalaro, Barone, and Kalinowski (2015, 2016, 2017a, 2017b, 2018, 2019a, 2019b) in Connecticut and Rhode Island, Racial & Identity Profiling Advisory Board (2020) in California, and Sanchagrin et al. (2019) in Oregon.
[4] Note that the sample of traffic stops used in this analysis included only those resulting in a citation and did not include those stops resulting in a verbal warning. We also drop 48,300 traffic stops without a time recorded.
[5] Note that we also conduct a robustness check where we further restrict the sample of 331,318 stops involving a speeding violation.
Total Veil of Darkness Estimates
Figure 1 contains a graphical presentation of the results from applying the solar visibility analysis to the Massachusetts traffic stop data from 2014-22, see Equation 1 in the appendix for technical details. Panel (a) presents the estimated change in the likelihood a Black/African American motorist was stopped in daylight relative to darkness, panel (b) presents the difference for Hispanic/Latinx motorists, and panel (c) presents the difference for an aggregate of any racial or ethnic underrepresented group (include Black/African American and Hispanic/Latinx). The baseline comparison group in both panels consists of traffic stops made of Caucasian (i.e. White non-Hispanic/Latinx) motorists. The vertical axis denotes the change from daylight to darkness in the predicted probability that a traffic stop involves a person of color. Each marker plots the point estimate for a given year and the bounds plot a 95 percent confidence interval. The dashed line represents the point estimate obtained from the combined sample of all years.
Figure 1: Veil of Darkness Estimates, 2014-22
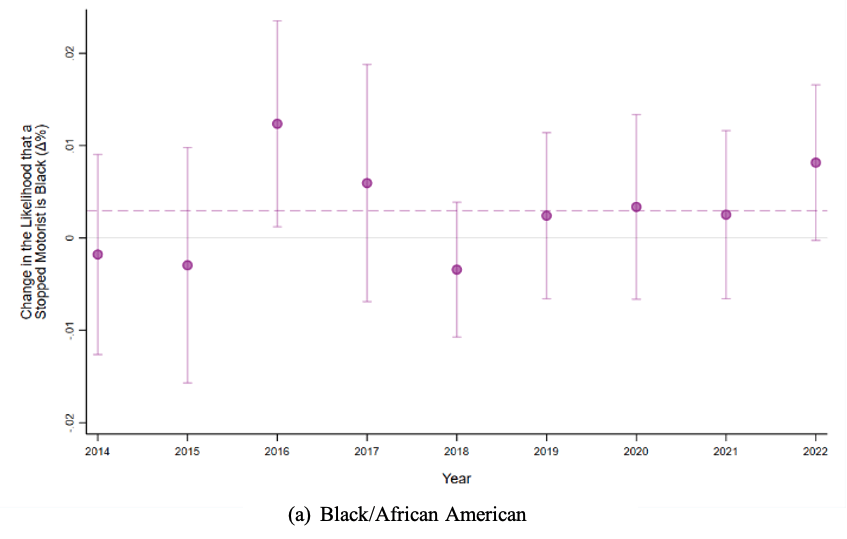
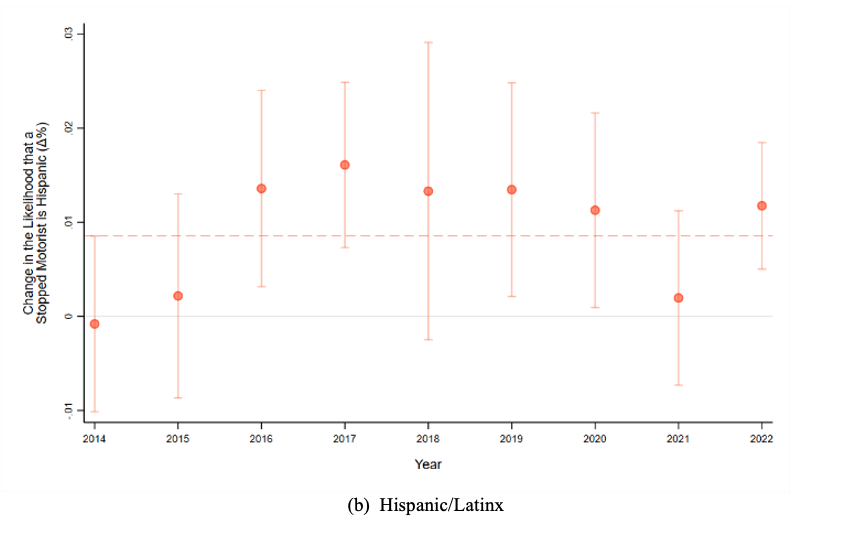
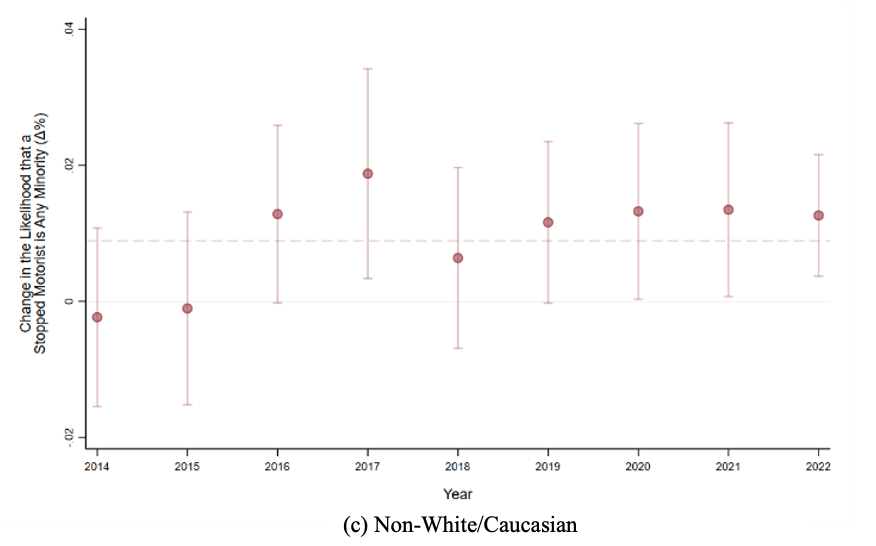
Notes: The results for panels (a), (b), and (c) are estimated on a sample traffic stops made of White non-Hispanic and Black/African American, Hispanic/Latinx, or a any person of color during the inter-twilight. The figure plots the change in the likelihood a person of color is stopped in daylight relative to darkness as well as the associated 95 confidence interval. The estimates were obtained from a linear probability model regressing an indicator for race on an indicator for daylight as well as controls for time of day, day of week, and badge. The standard errors, used to construct the confidence intervals and to conduct the hypothesis test denoted by the p-value, were two-way clustered at the badge and agency.
As shown above in panel (a), we find that Black/African American motorists were 0.29 percentage points (2 percent relative to a mean of 14.81 percent) more likely to be represented in the traffic stop data during periods of daylight relative to darkness. With respect to panel (b), we find that Hispanic/Latinx motorists were 0.86 percentage points (6 percent relative to a mean of 13.99 percent) more likely to be represented in the traffic stop data during daylight. With respect to panel (c), we find that all underrepresented groups were 0.89 percentage points (3 percent relative to a mean of 31.6 percent) more likely to be represented in the traffic stop data during daylight. The estimates for Black/African American motorists were only significant at a confidence level just above 85 percent while the results for Hispanic and all underrepresented groups were significant at a confidence level exceeding 99 percent. Across all years, the point estimates were consistently positive but highly significant in six of nine years (i.e. 2014, 2015, 2016, 2017, 2019, and 2020).
The relatively large and persistent disparity suggests that Massachusetts police are more likely to stop a person of color during periods when they can more easily discern their race/ethnicity. The conventional interpretation of these results is that it is indicative of potential discrimination by Massachusetts police against motorists of color.
The technical appendix contains an additional robustness test using a sample of data just before/after daylight savings time (Figure A.1), on a more restrictive subsample of speeding violations (Figure A.2), and with an additional set of vehicle and motorist controls (Figure A.3).
Individual Agency Estimates
Figure 2 plots the odds a Black/African American (panel a), Hispanic/Latinx (panel b), or any person of color (panel c) motorist is stopped relative to a non-Hispanic Caucasian motorist in daylight versus darkness by department in the most recent three years of data from 2020-22. Individual points on the figure represent specific departments and state police troops. The vertical axis plots the odds a stopped motorist is a person of color in darkness and the horizontal axis plots the same odds in daylight. For ease of presentation in the figure, we approximate the regression results by imposing the coefficient estimate of daylight on the probability a person of color is stopped in darkness during the inter-twilight window.[6] The red 45-degree line represents parity (equal treatment) between daylight and darkness. Thus, only departments falling below this line (bottom right quadrant) are more likely to stop motorists of color during daylight when their race is more easily observed.
Figure 2: Individual Agency Veil of Darkness Estimates, 2020-22
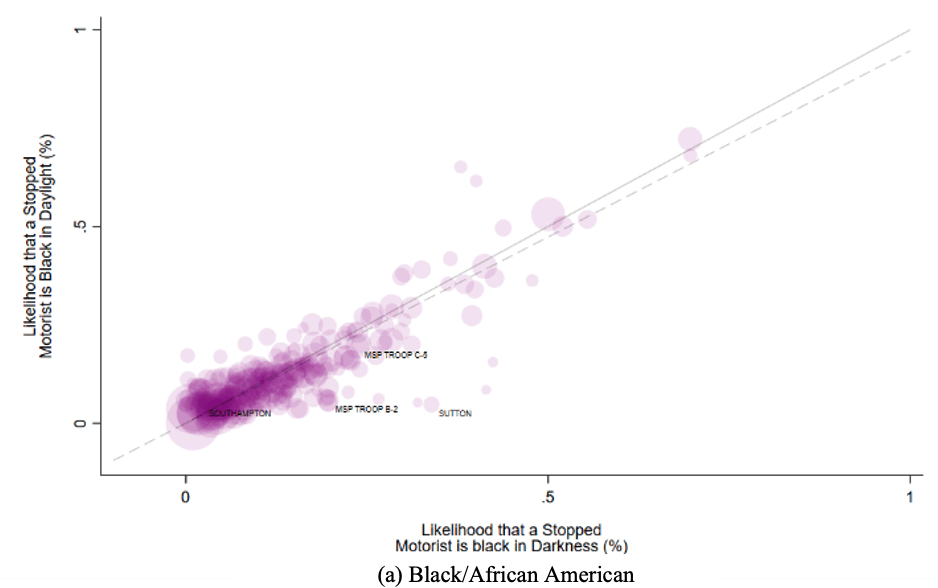
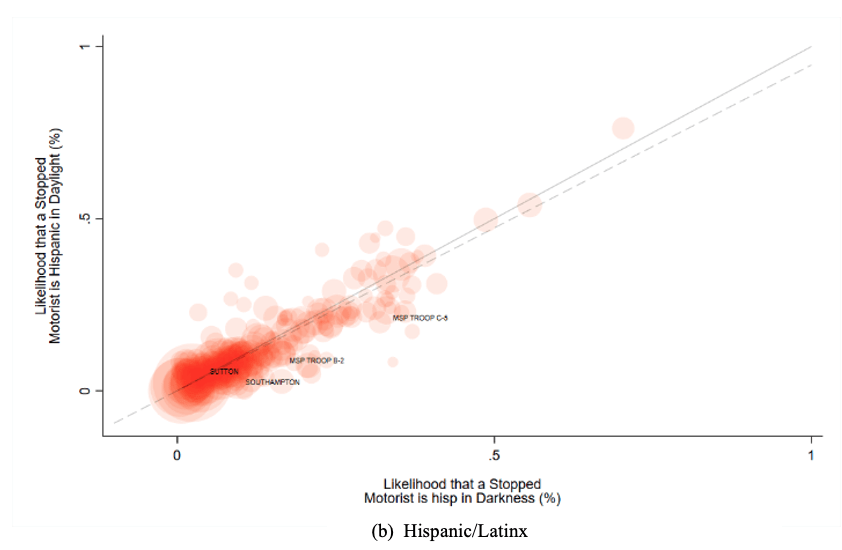
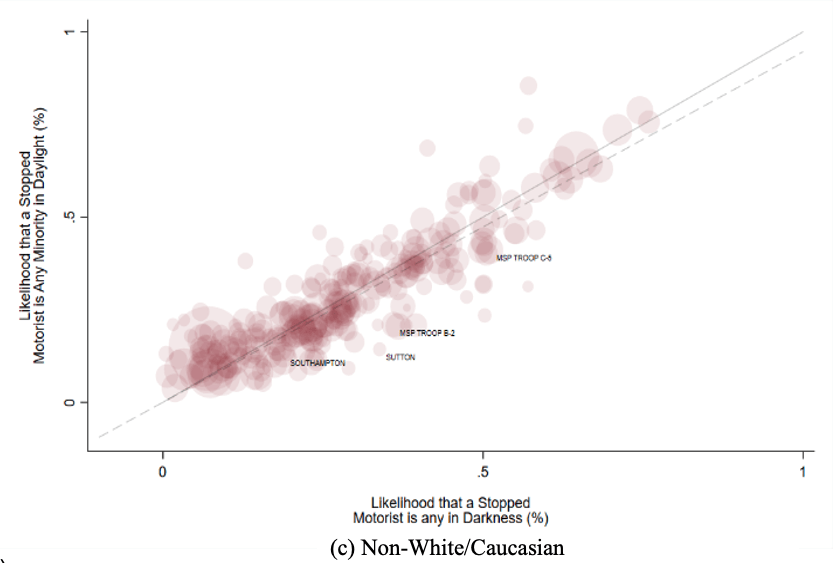
Notes: Notes: The results for panels (a), (b), and (c) are estimated on a sample traffic stops made of White non-Hispanic and Black/African-American, Hispanic/Latinx, or a any person of color during the inter-twilight for each 303 policing agencies. The figure plots the change in the likelihood a person of color is stopped in daylight relative to darkness. The estimates were obtained from a linear probability model regressing an indicator for race on an indicator for daylight as well as controls for time of day, day of week, and badge.
Using the combined 2020-22 data, we identified a total of 33 agencies (11 state police troops and 22 municipal agencies) that were more likely to have stopped a person of color in daylight relative to darkness and where that disparity was estimated with a confidence level exceeding conventional thresholds (i.e. p<0.05).[7] Since we are effectively running three hypothesis tests across 313 distinct agencies, we account for the possibility of committing a type one error through multiple comparisons by calculating a false discovery rate following Simes (1986). Of those 33 agencies, the 4 most precisely estimated disparities (i.e. q<0.1) were found in Sutton (Black/AA: 19.54pp or 612%, p<0.001, q<0.05), Southampton (Hispanic/Latinx: 5.02pp or 107%, p<0.001, q<0.05), State Police Troop B-2 (Black/AA: 13.88pp or 240%, p<0.001, q<0.05), and State Police Troop C-5 (Hispanic/Latinx: 9.6pp or 41%, p<0.001, q<0.075).[8] The technical appendix contains additional results for 2022 (Figure A.4) and the combined 2014-22 (Figure A.5).
[6] More specifically, the odds of a minority stop in darkness is the uncontrolled raw level rather than the regression adjusted level. We do this for simplicity and ease of exposition.
[7] Kalinowski et al. (2022) provide evidence that a statistically significant negative coefficient estimate can also be indicative of potential discrimination. In total, there were an additional 29 agencies that were less likely to have stopped a minority motorist in daylight relative to darkness and where that disparity was estimated with a confidence level exceeding conventional thresholds (i.e. p<0.05).
[8] Of those 29 agencies, Norwell (Black/AA: -3.5pp or 107%, p<0.001, q<0.01) was the most precisely estimated.


Dr. Matthew B. Ross is an Associate Professor in the The School of Public Policy and Urban Affairs at Northeastern University is committed to interdisciplinary thinking and problem solving on issues of pressing concern at the local, state, national, and international levels – from transportation, housing, energy and community development to social and environmental justice, resilience and sustainability. By educating students in both theory and practice, the School prepares them to become effective contributors to social, economic, and environmental change, in careers spanning the public, private, and nonprofit sectors, as well as academic research.
Community to Community (C2C) is an impact accelerator at Northeastern University designed to deepen the university’s commitment to community engaged research at each of its global campus locations. We strive to move the needle on societal problems at the local level, benefitting the areas our university calls home, while also promoting knowledge transfer across communities that are grounded in the local context.
